
Building PatternRank: research-grade equity rankings without trade calls
PatternRank is positioned as a research workflow for US equities, not a trading recommendation engine.
PatternRank started as an internal research system.
After spending roughly a decade studying Indian markets, I wanted to bring a stricter research process into public US equities. Most retail screening tools make it easy to sort tickers. Far fewer force the uncomfortable parts of research: walk-forward validation, survivorship-bias handling, corporate-action adjustment, realistic execution assumptions, and honest follow-through after a ranking is produced.
That gap became the product brief. PatternRank would not be another place to make confident trade calls. It would rank equity setups with model-derived evidence, show confidence and outcome context, and keep the product language firmly in research territory.
The flagship product is the US 7-day momentum workflow. The rankings refresh after the US market close. Historical rankings remain visible once their 7-day outcome can be measured. The public app separates the standard 7D All Stocks universe from the 7D ETB universe, where ETB means Easy-to-Borrow and adds a liquidity and borrowability filter.
The Problem With Most Screeners
A simple screener answers a simple question: what matches these rules right now?
That is useful, but it leaves too much of the research process outside the system. A ranking product needs to answer a harder set of questions:
- Was this setup defined before the move, or after the chart already looked obvious?
- Was the model trained with future information leaking into the features?
- Did historical evaluation include names that later disappeared from the universe?
- Were corporate actions and adjusted prices handled consistently?
- Were results measured with realistic execution assumptions instead of perfect fills?
- Can a user review completed outcomes without turning the output into advice?
PatternRank was built around those questions. The product is less interesting as a dashboard and more interesting as a research pipeline that happens to have a dashboard at the end.
Getting the Labels Right
The earliest version of the system found historical breakout events, labeled the patterns around them, and trained models to recognize similar behavior.
That was useful for exploration, but it also exposed the main modeling risk. If a label is too close to the obvious breakout, the model can become good at recognizing a move after it is already visible. That is not the product I wanted to build.
The production workflow shifted toward pre-expansion labels — recognizing conditions before the setup becomes an obvious momentum move. That changed the product from "find stocks that already exploded" to "rank setups where the structure is beginning to form." The distinction matters because a model trained on confirmed breakouts tends to predict what the chart already shows, which is not useful research.
PatternRank is not trying to publish a perfect prediction. It is trying to make a research queue more disciplined.
The Architecture
The production story has two halves: a Python research pipeline and a web product that exposes the outputs.
The Python research pipeline drives the daily US scoring workflow:
market data update
  -> instrument and universe preparation
  -> technical indicator calculation
  -> feature generation
  -> ignition model scoring
  -> probability and confidence ranking
  -> EV-aware selection
  -> Supabase publishing
  -> completed performance update after the 7-day window
The model stack is deliberately conventional at the public explanation level: tree-based ML with XGBoost and LightGBM-style models, optional ensemble and calibration work, and feature contribution summaries for review. The edge is not the name of an algorithm. The edge is in the data hygiene, label design, feature construction, universe filters, validation process, and the habit of measuring outcomes after publication.
The product side is a Next.js app hosted on Vercel, with Clerk for auth and Supabase as the product database. The public site exposes the marketing pages, sample rankings, pricing, and research disclaimers. Authenticated users can inspect current rankings, historical rankings, performance analytics, model types, and feature contribution context.
What Gets Published
PatternRank intentionally publishes a small, reviewable surface:
7D All Stocks: short-horizon momentum rankings across NYSE and NASDAQ equities.7D ETB: an Easy-to-Borrow ranking universe with additional liquidity and borrowability constraints.1Y2X: a long-horizon breakout model in beta.Crater: a short-side model marked as coming soon, not the core public story.
For this article, the main story is only the US 7D momentum product. India, crypto, and other experiments are outside the scope. They exist as research history, not as the public PatternRank positioning.
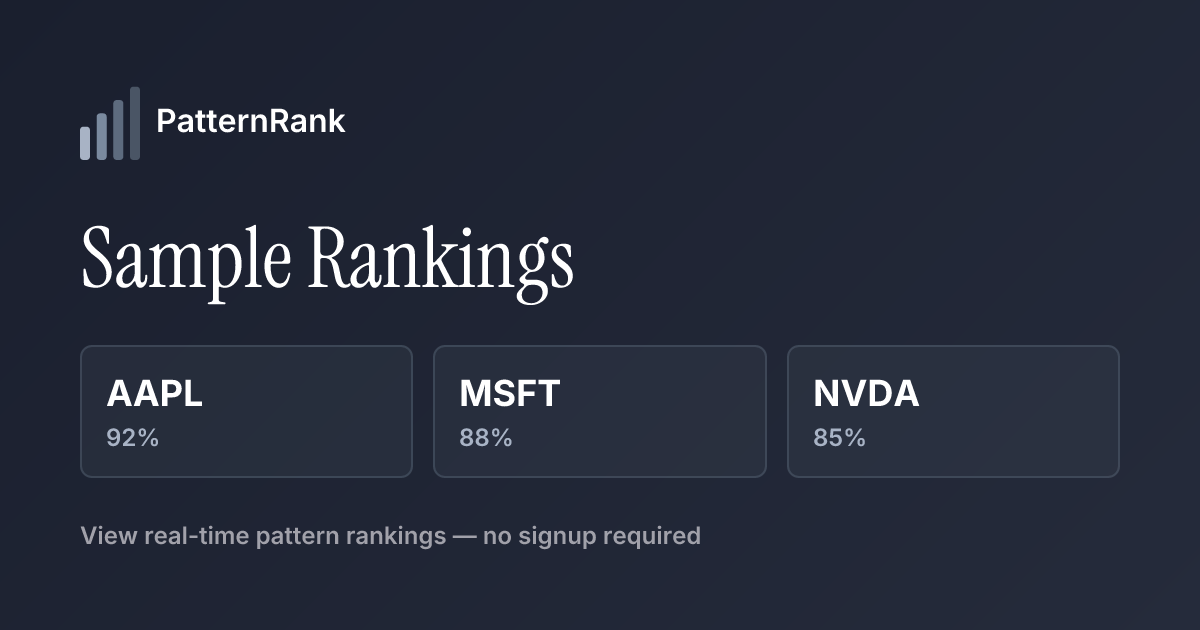
The sample page shows completed rankings with confidence, entry context, model type, and measured 7-day outcome.
Measurement Without Overclaiming
PatternRank's public performance data should be read as historical ranking outcome analysis, not realized trading performance and not a promise about future returns.
As of this draft, the public performance API reports measured 7-day outcomes from January 1, 2026 through June 10, 2026, covering 160 days.
| Model | Signals | Avg 7D outcome | Win rate | Sharpe | Max drawdown | Cumulative return |
|---|---|---|---|---|---|---|
| 7D All Stocks | 897 | 3.12% | 52.4% | 2.64 | -7.67% | 58.9% |
| 7D ETB | 627 | 2.98% | 53.6% | 2.19 | -6.61% | 74.5% |
Cumulative return is compounded across all signals in the period.
Those numbers are useful because they force the product to be accountable to completed rankings. They are also intentionally incomplete if read outside the research context. They do not include a user's sizing, entries, exits, taxes, broker constraints, slippage, or personal risk profile. PatternRank does not make those decisions.
One interesting detail is that both distributions are right-tailed. The median 7-day outcome sits below 1% for both models — 0.62% for All Stocks and 0.73% for ETB — while the mean is pulled higher by a smaller number of large winners. The ETB universe shows this more strongly: its outcome distribution carries a pronounced positive skew, with upside outliers significantly larger than the downside tail. That asymmetry is why the compounded cumulative return for ETB (74.5%) runs well ahead of All Stocks (58.9%) despite a slightly lower average per signal. It is also exactly why I care more about drawdown, stability, and evaluation process than headline return screenshots. A research tool should help users understand the shape of the distribution, not just celebrate the best examples.
Product Decisions
The product decisions came from the research constraints.
First, the UI needed to separate ranking from recommendation. The dashboard shows model type, confidence, rank, entry context, and completed outcome. It does not tell a user what to buy, how much to size, or when to exit.
Second, historical review needed to stay open. Completed performance is available without signup because trust should start with inspectable outcomes, not gated claims.
Third, model coverage had to be explicit. A 7D All Stocks ranking and a 7D ETB ranking are not the same product surface. The ETB filter exists for researchers who want a more conservative universe with additional liquidity and borrowability constraints.
Fourth, feature contributions had to be visible enough to support review, but not so detailed that the product becomes a leak of the entire research system. The product can show the top factors behind a ranking while keeping exact feature definitions, transformations, thresholds, and label construction private.
Finally, the legal language is part of the product. PatternRank is presented as educational analytics and research infrastructure. It is not investment advice, not personalized guidance, and not a trade recommendation service.
What I Would Build Again
The best decision was treating the research system as a product from the start.
That meant the unglamorous pieces mattered early: auth, plans, sample pages, model configuration, daily refreshes, materialized views, performance APIs, legal pages, and language that did not overstate what the models do.
It also meant the research code had to serve a repeatable workflow. The daily pipeline is not just a script that prints tickers. It prepares the universe, scores candidates, selects rankings, publishes structured data, updates completed outcomes, and keeps the product-facing dashboard current.
That is the real lesson from PatternRank: the hard part is not getting a model to output a score. The hard part is building a system around the score so it can be reviewed, challenged, measured, and improved without becoming a black-box recommendation engine.
Research systems become products when they make discipline easier to repeat. That is what PatternRank is trying to do.